|
 |
 |
|
Developed tools 1. mIMT-visHTS (publication here)
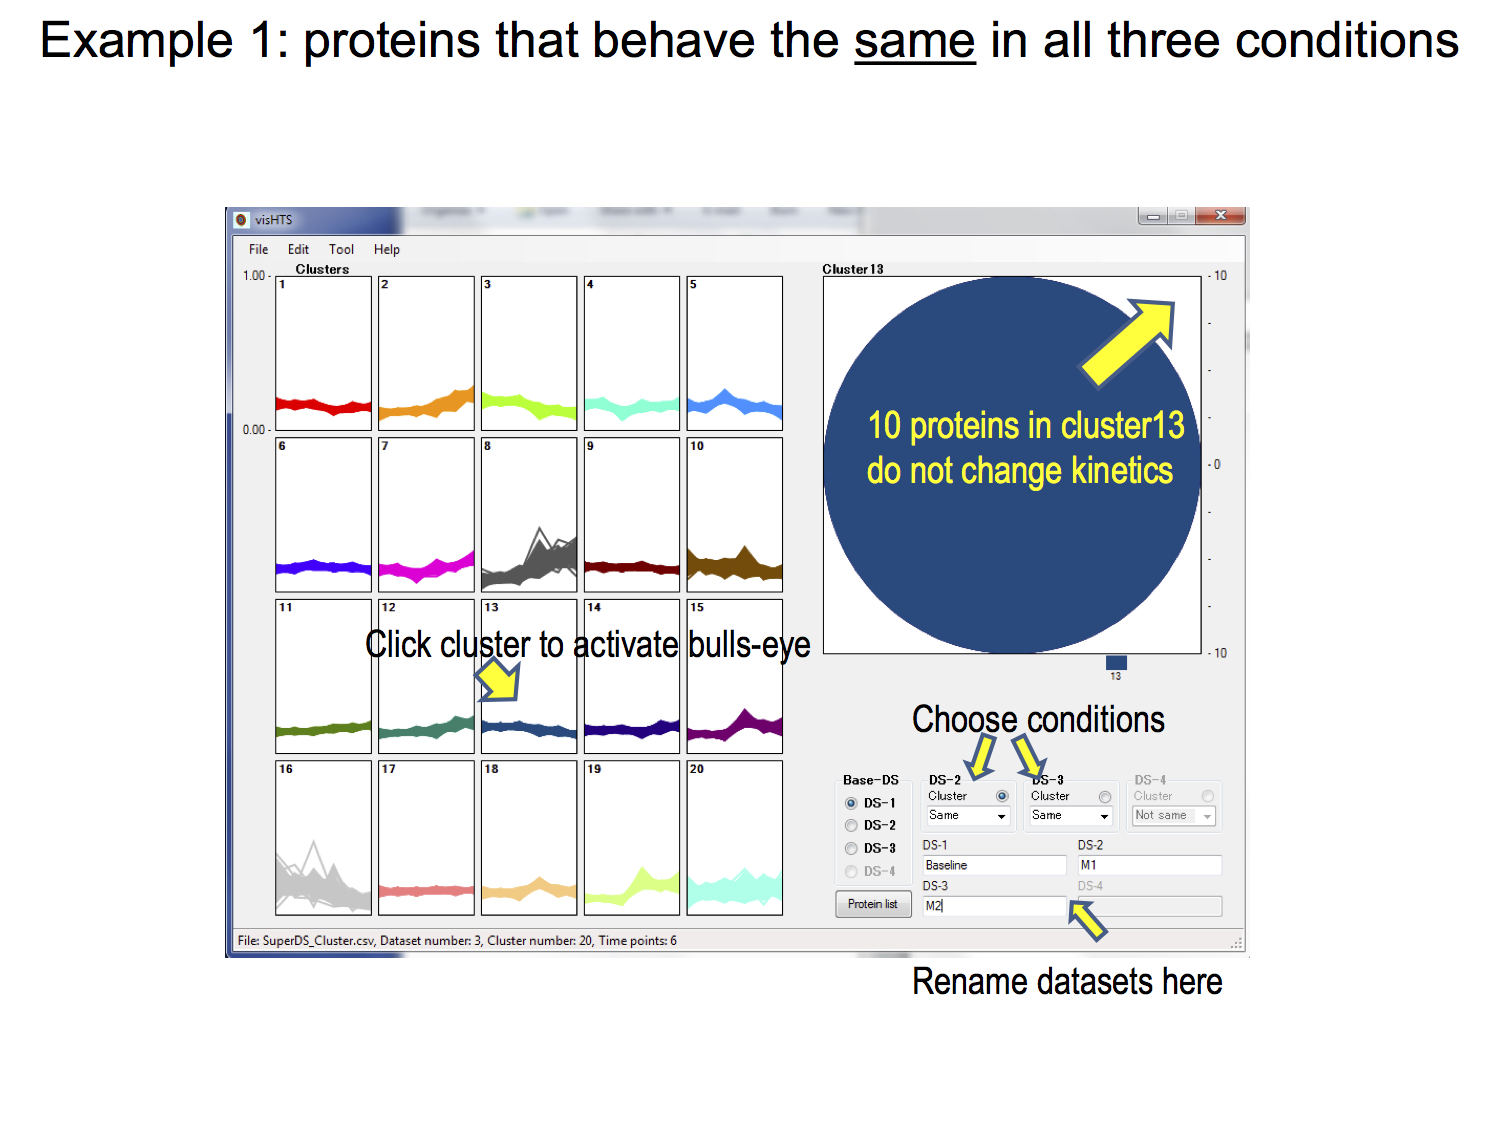
mIMT-visHTS is a software for multiplexing time-resolved protein abundance profiles, typically collected by, but not limited to, isobaric mass tagging methods. The only input needed is the file containing the relative protein abundances. The downloadable package includes:
Software Snapshot : Proteins in different conditions hold the same kinetics and classified in cluster 13
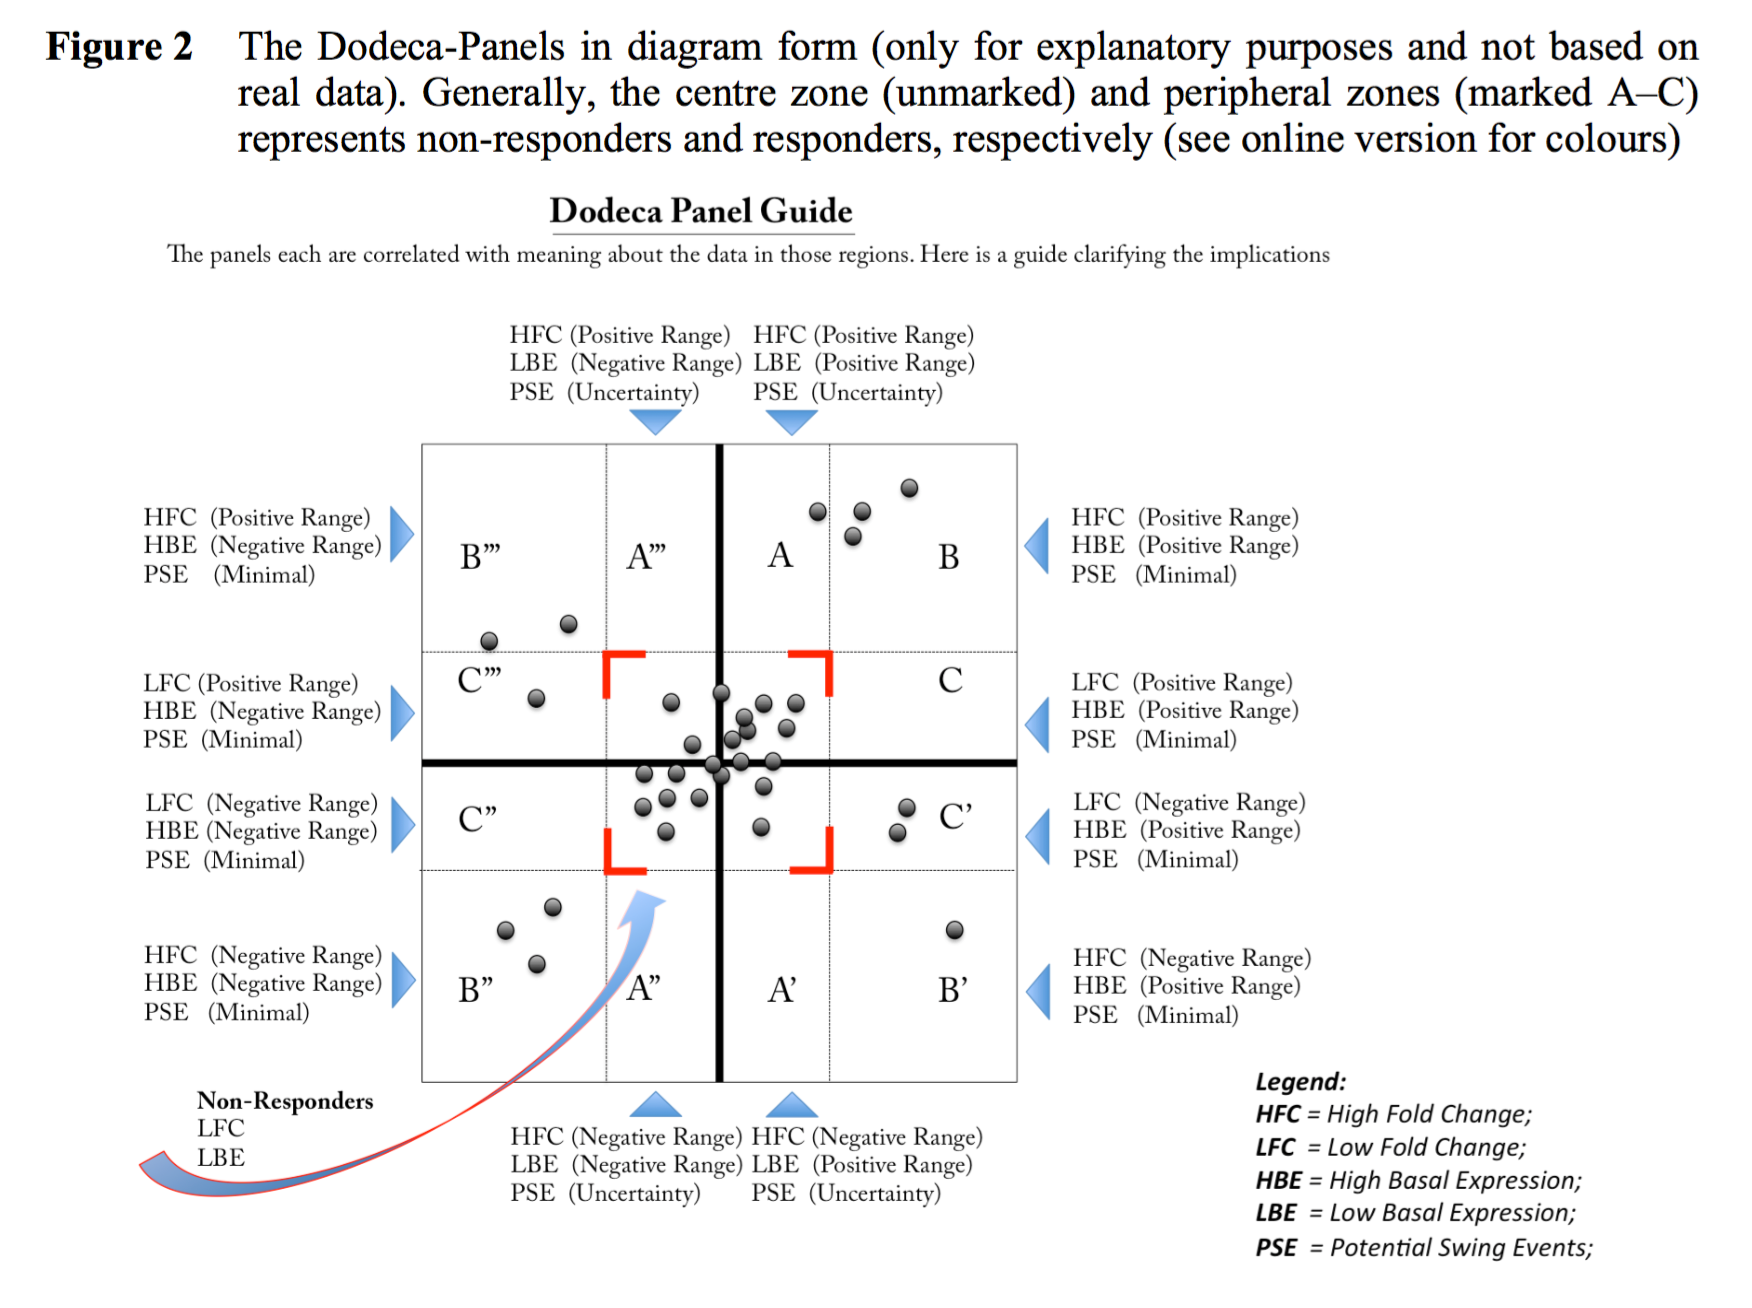
2. A novel tool for analysing extremely small sized ratio datasets: Dodeca Panel (publication here)
The naïve use of expression ratios in high-throughput biological studies can greatly limit analytical outcome especially when sample size is small. In the worst-case scenario, with only one reference and one test state each (often due to the severe lack of study material); such limitations make it difficult to perform statistically meaningful analysis. Workarounds include the single sample Z-test or through network inference. Here, we describe a complementary plot-based approach for analysing such extremely small sized ratio (ESSR) data – a generalisation of the Bland-Altman plot, which we shall refer to as the Dodeca-Panels. Included in this paper is an R implementation of the Dodeca-Panels method.
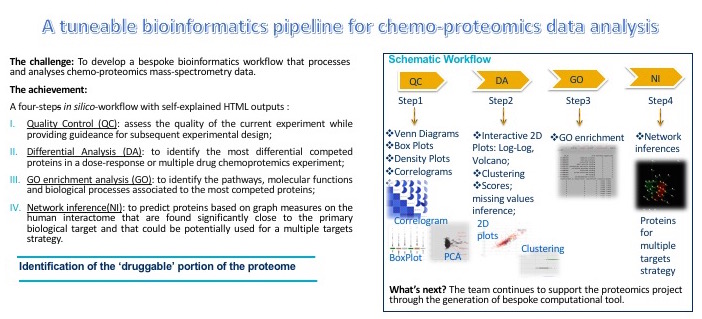
3. DOSCHEDA (publication here)Mass Spectrometry (MS) based chemoproteomics has recently become a main tool to identify and quantify cellular target protein interactions with ligands/drugs in drug discovery. The complexity associated with these new types of data requires scientists with a limited computational background to perform systematic data quality controls as well as to visualize the results derived from the analysis to enable rapid decision making. To date, there are no readily accessible platforms specifically designed for chemoproteomics data analysis.
Typical Workflow:
Chemo-protoemics readings:
|